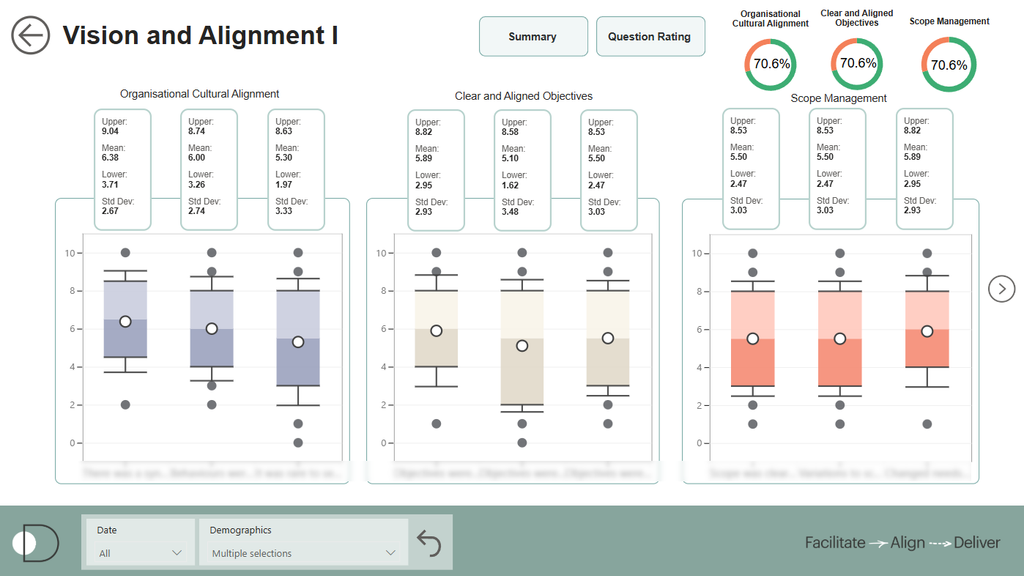

Odaptic's Power BI Reporting: Streamlining the Survey Process
How Odaptic transitioned from manual survey report generation to an automated Power BI process, reducing time from days to 1-3 hours while delivering richer insights.
View the projectReporting and dashboards
If the answer takes someone two days to assemble, you find out too late to do anything about it. We build Power BI reporting that answers it on a Tuesday, from the systems you already run.
You almost certainly have the numbers already. They're just sitting in four systems and a spreadsheet, and pulling them together is a job nobody has time for until someone asks a hard question.
So it gets done monthly, if you're disciplined. Quarterly, if you're honest. And the job that quietly ate its margin finished five weeks before anyone noticed.
We build dashboards in Power BI that connect to your accounting package, job management, timesheets and project tools, and keep themselves current. Most of the real work happens underneath: getting data out cleanly, matching records that don't share an ID, and handling the awkward cases so the number on screen survives being challenged in a meeting.
That last part is the whole game. A dashboard nobody trusts gets checked against a spreadsheet every single time, which leaves you worse off than before.
What people ask for first
Actual labour, materials and subcontractors against what you quoted, per job. You stop finding out at the end and start correcting mid-job.
Quotes, invoices and commitments in one view, so a cash gap shows up six weeks out instead of on a bank statement.
Time against jobs and against people, with overtime visible while you can still decide between paying it and hiring.
Exception reporting. Nobody reads 4,000 lines. You get told about the nine that don't look right.
Before you spend anything
Both are worth knowing now rather than three weeks in.
If jobs are coded inconsistently, or half the timesheets land a week late, a dashboard shows that in high definition and everyone blames the dashboard. Sometimes the process has to be fixed first. We'll tell you that rather than build something that makes the mess look official.
Ask two people in your business to define margin and you'll get two answers. That argument has to happen once, out loud, with a decision at the end. It is reliably the most valuable hour of the project and the one people most want to skip.
We work across the rest of the Microsoft stack where it earns its place: Power Apps, Power Automate, Dataverse and SharePoint. If you already pay for Microsoft 365, a fair amount of this is licensed to you and sitting idle, which is worth checking before anyone buys another tool. See software licensing and spend review.
Real projects for Australian businesses, including what it actually took.
How Odaptic transitioned from manual survey report generation to an automated Power BI process, reducing time from days to 1-3 hours while delivering richer insights.
View the project

We helped Impact Plumbing streamline workforce management, eliminating paper-based processes, boosting transparency and efficiency, and providing real-time oversight for their 60+ team.
View the project
Using Power Apps, we helped Hyforce Engineering replace their rigid field service system with a flexible, integrated solution that streamlines time tracking, sales, and field operations.
View the projectTell us the question you keep answering by hand. That one question is usually enough to work out whether this is a reporting job, an integration job, or a process automation job. Often it's some of each, and the order you do them in matters.
Show us the spreadsheet. We'll tell you what it would take to retire it.